
How do we determine common topics in a collection of documents? How do we group documents by topic? The first task is called topic modeling, and the second is called clustering. We can do both using word embeddings, AI, and some classical machine learning.
Table of Contents
- What is topic modeling, and how can AI improve it?
- Required Python Libraries
- Loading the data
- Generating Word Embeddings
- Dimensionality Reduction
- Clustering
- Determining the Topics
What is topic modeling, and how can AI improve it?
Topic modeling is an unsupervised machine-learning technique for discovering common themes in a collection of documents. We achieve the goal by partitioning the dataset of records (called a corpus) into groups with a common set of keywords that capture the topic’s essence.
After matching documents to groups, we must determine what each group is about. Instead of guessing the topic by reading the documents or looking at keywords, we will let AI choose the topic. Additionally, we won’t use Bag of Words or TF-IDF to represent documents. Instead, we will use word embeddings. Embeddings will preserve the meaning of words and allow us to match documents even when they contain synonyms.
Required Python Libraries
Let’s start by installing the required Python libraries. We will need:
- openai - for word embeddings and access to the AI model
- umap-learn - for dimensionality reduction
- scikit-learn - for clustering
- pandas - for reading the data
- numpy - for preparing the data before dimensionality reduction
- tqdm - for displaying the progress bar while applying a function to each row of the DataFrame
- matplotlib - for plotting the chart of clusters
Loading the data
I have a dataset of questions and answers generated from the articles on this website. You can generate such a dataset using the Doctran library. If you’re looking for ways to solve business problems with AI, topic modeling is one of the powerful techniques you should consider.
All we have to do is load the CSV file into a Pandas DataFrame.
import pandas as pd

df = pd.read_csv('data.csv')
Generating Word Embeddings
We will use the OpenAI Embeddings Endpoint to convert the text into vectors. Therefore, we must import the openai` library and set the API key.
import openai

openai.api_key = '...'
A call to the endpoint takes some time, and I would like to see a progress bar while running the apply function in Pandas, so let’s import and configure the tqdm library.
from tqdm.notebook import tqdm

tqdm.pandas()
Now, let’s define the function calling the OpenAI API and retrieving the word embeddings. The function converts the text to lowercase. If your documents contain any special characters, HTML or Markdown tags, or anything else you may want to remove, you must do the preprocessing before calling the API. I’m sure my dataset contains only text, so I don’t need more preprocessing code.
def embeddings(prompt):
    prompt = prompt.lower()
    response = openai.Embedding.create(
        input=prompt,
        model="text-embedding-ada-002"
    )
    return response['data'][0]['embedding']
In the last step, we call the progress_apply function to apply the embeddings function to each row of the DataFrame. The progress_apply function is a wrapper around the apply function that displays a progress bar.
df['embeddings'] = df['qa'].progress_apply(lambda x: embeddings(x))
Dimensionality Reduction
We won’t use the embeddings returned by OpenAI because they are huge. Each vector has 1536 elements. Good luck calculating similarity in 1536-dimensional space.
Because of the Curse of Dimensionality, the distance metric becomes meaningless in high-dimensional spaces. Additionally, it’s computationally expensive to calculate the distance between two vectors with 1536 elements. If those problems weren’t terrible enough, high-dimensional data is often sparse and may contain noise irrelevant to the clustering task but affecting the distance between vectors. On top of that, we can’t visualize the data in 1536 dimensions, and I want to see a chart.
We will use UMAP to reduce the dimensionality of the vectors to 2.
import numpy as np
import umap

reducer = umap.UMAP()
embedding_list = df['embeddings'].tolist()
embedding_matrix = np.stack(embedding_list, axis=0)
reduced_embeddings = reducer.fit_transform(embedding_matrix)

df['reduced_embeddings'] = list(reduced_embeddings)
Clustering
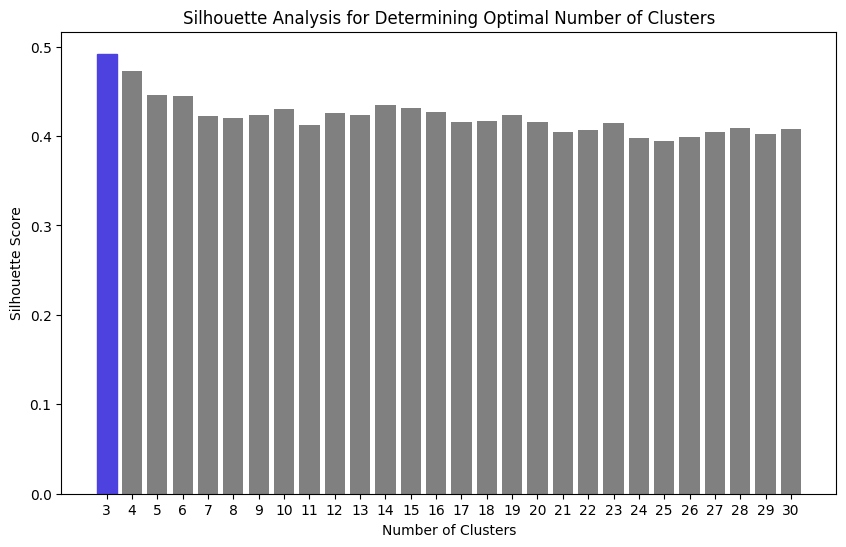
We are ready to cluster the documents. However, clustering requires knowing how many clusters we want to create. I have no clue. We could use the elbow method to find the optimal number of clusters, but I want a quantitative measure of the quality of the clusters. Therefore, I will use the silhouette score. The silhouette score measures how similar an object is to its cluster compared to other clusters by calculating the distance between objects within and between clusters.
I want to find the optimal number of clusters, so I will calculate the silhouette score for different numbers of clusters and choose the one with the highest score.
from sklearn.cluster import KMeans
from sklearn.metrics import silhouette_score

X = df['reduced_embeddings'].tolist()

n_clusters_range = range(3, 31)

silhouette_scores = []

# (n_clusters, silhouette_score, kmeans)
# starting with score 0 because negative values indicate terrible clusters
cluster_with_max_silhouette = (0, 0, None)

for n_clusters in n_clusters_range:
    kmeans = KMeans(n_clusters=n_clusters, random_state = 1234)
    cluster_labels = kmeans.fit_predict(X)

    silhouette_avg = silhouette_score(X, cluster_labels)
    silhouette_scores.append(silhouette_avg)
    if silhouette_avg >= cluster_with_max_silhouette[1]:
        cluster_with_max_silhouette = (n_clusters, silhouette_avg, kmeans)
In the end, the cluster_with_max_silhouette variable contains the optimal number of clusters, the silhouette score, and the KMeans object we can use to assign documents to clusters.
Let’s take a look at the chart of the silhouette scores.
import matplotlib.pyplot as plt

plt.figure(figsize=(10, 6))

bars = plt.bar(n_clusters_range, silhouette_scores, color='gray')

max_index = np.argmax(silhouette_scores)
bars[max_index].set_color('#4d41e0')

plt.xticks(n_clusters_range)

plt.xlabel('Number of Clusters')
plt.ylabel('Silhouette Score')
plt.title('Silhouette Analysis for Determining Optimal Number of Clusters')

plt.show()
After creating the clusters, we have to assign the documents to the clusters:
kmeans = cluster_with_max_silhouette[2]
cluster_labels = kmeans.predict(X)
df['cluster'] = cluster_labels
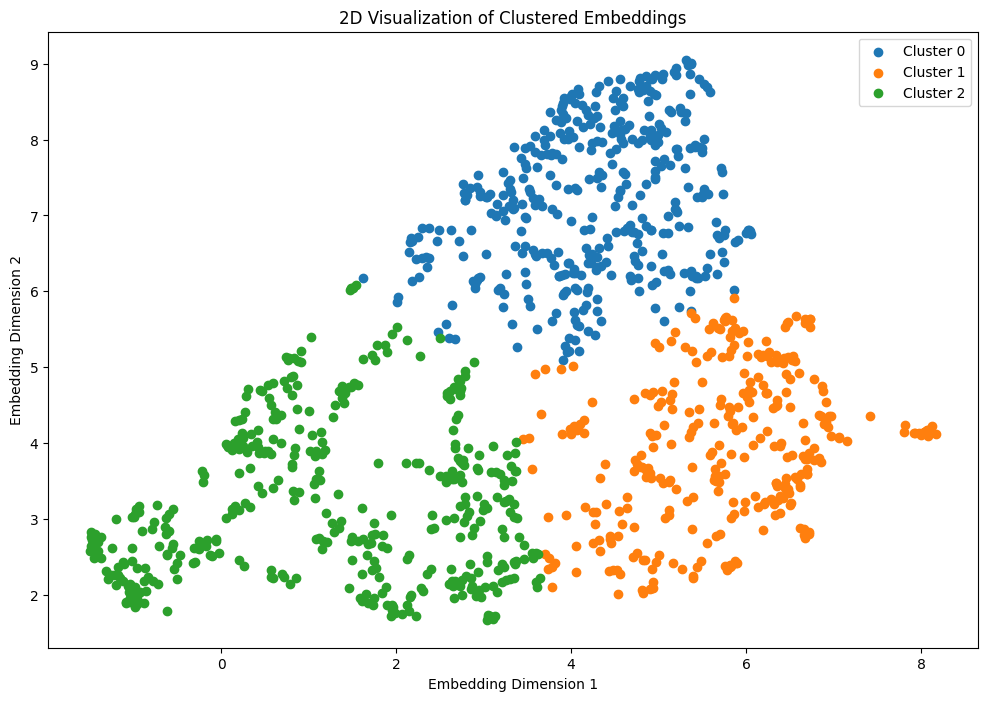
I told you I wanted to see a chart of my clusters. We can’t possibly interpret what the chart shows, but the visualization looks cool:
embeddings = np.stack(df['reduced_embeddings'].values)
clusters = df['cluster'].values

unique_clusters = set(clusters)

plt.figure(figsize=(12, 8))

for cluster_id in unique_clusters:
    cluster_indices = np.where(clusters == cluster_id)
    cluster_embeddings = embeddings[cluster_indices]

    x_coords = cluster_embeddings[:, 0]
    y_coords = cluster_embeddings[:, 1]
    plt.scatter(x_coords, y_coords, label=f"Cluster {cluster_id}")

plt.title("2D Visualization of Clustered Embeddings")
plt.xlabel("Embedding Dimension 1")
plt.ylabel("Embedding Dimension 2")

plt.legend()
plt.show()
Determining the Topics
We have the clusters but don’t know what they are about. We can’t read all the documents in each group, so we will let AI read them. I ask AI for the classification and topic description in the prompt. The description not only gives me an explanation, but because I asked for the description before the topic name, AI has some space to “think” (Similarly to the Chain-of-Thought prompting technique).
CLASSIFICATION_PROMPT = """Given a list of questions and answers. Classify the topic of those questions and answers.

Return the response in the format:
Description: 2-3 sentences of the common theme among all entries.
Class name: A noun (1-3 words) that encompasses the description and can be used as the class name during classification."""

def classify_group(prompt):
  response = openai.ChatCompletion.create(
      model="gpt-3.5-turbo",
      messages=[
          {"role": "system", "content": CLASSIFICATION_PROMPT},
          {"role": "user", "content": prompt},
      ]
      )
  return response['choices'][0]['message']['content']
Now, I will ask for the classification and display a few questions and answers from the cluster. I run my code in a Jupyter Notebook, so I will create a Markdown text and use the display function to show the formatted text. To limit the prompt size, I sent only the cluster’s first 30 questions and answers. While displaying, I reduced the number of questions and answers to 5.
from IPython.core.display import display, Markdown

cluster_counts = df['cluster'].value_counts()
for cluster in cluster_counts.index:
  cluster_content = df[df['cluster'] == cluster][['qa']].values
  prompt = ""
  for issue in cluster_content[0:30]:
    prompt += f"""```{issue[0]}```

"""
  cluster_class = classify_group(prompt)

  markdown_text = f"Cluster: {cluster_class}\n\n"
  for example in cluster_content[0:5]:
    markdown_text += f"* {example[0]}\n\n"
  display(Markdown(markdown_text))
To shorten the article, I won’t include the questions and answers, but I will show you the topics:
Cluster: Description: These questions and answers cover a variety of topics related to data processing and programming, including Hive, Spark, Slack, MySQL, AWS services, and data manipulation functions. Class name: Data Processing and Programming

Cluster: Description: The questions and answers revolve around various topics such as software development practices (e.g. Domain Driven Design, Test-Driven Development), programming principles (e.g. functional programming), marketing techniques, technical documentation, public speaking, and storytelling. Class name: Software Development & Practices

Cluster: Description: The common theme among all entries is that they involve various topics in data analysis, machine learning, and statistical concepts. Class name: Data and Machine Learning Analysis
The results are pretty good. If you remember the Silhouette score graph and wonder what would be the 4th cluster, it’s AWS. I write a lot about AWS.
Go From AI Janitor to AI Architect
Stop debugging unpredictable AI systems. I can help you build, measure, and deploy reliable, production-grade AI applications that don't hallucinate.
Message me on LinkedIn