In this article, I am going to describe how to use an exponentially weighted moving average for anomaly detection. It certainly is one of the dullest methods to do it, but in some cases, the moving average may be enough.
The method works well if we can make two assumptions about data:
-
The values are Gaussian distributed around the mean.
-
There is no seasonality.
In my example, I used the daily number of visitors on my website. I had to split the data into workday and weekend data because of the huge difference in values.
First, I have to choose the length of the moving window. A longer window is less susceptible to changes in values and may detect more outliers. Possibly some of them may be false positives.
A shorter moving window adapts quickly to changing values, which in consequence may cause missed alarms afterward.
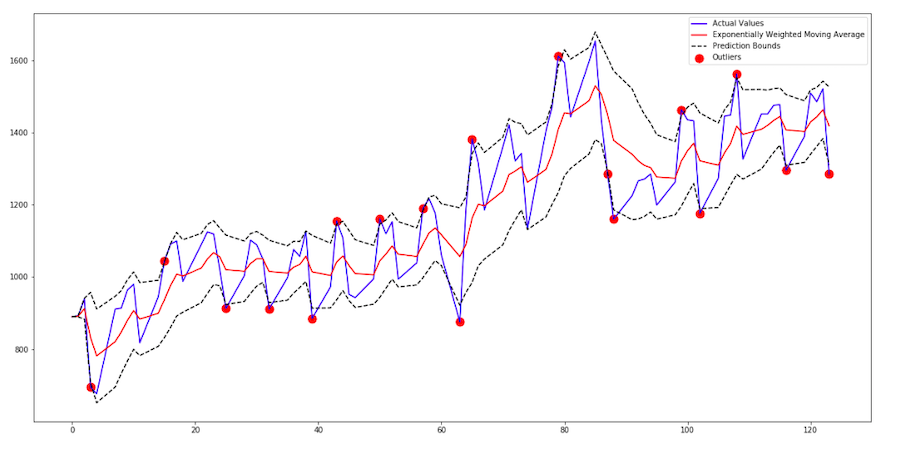
I decided to use a three-day window. Now, I have to calculate the moving average and moving standard deviation. In addition to that, I should determine what constitutes to be an outlier. In this example, an outlier is a value that differs by more than one standard deviation from the mean.
import pandas as pd
import matplotlib.pyplot as plt

window_size = 3
mean = work_days['Users'].ewm(window_size).mean()
std = work_days['Users'].ewm(window_size).std()
std[0] = 0 #the first value turns into NaN because of no data

mean_plus_std = mean + std
mean_minus_std = mean - std

is_outlier = (work_days['Users'] > mean_plus_std) | (work_days['Users'] < mean_minus_std)
outliers = work_days[is_outlier]

plt.plot(work_days['Users'], c = 'b', label = 'Actual Values')
plt.plot(mean, c = 'r', label = 'Exponentially Weighted Moving Average')
plt.plot(mean_plus_std, 'k--', label = 'Prediction Bounds')
plt.plot(mean_minus_std, 'k--')
plt.scatter(outliers.index, outliers['Users'], c = 'r', marker = 'o', s = 120, label = 'Outliers')
plt.legend()