
We can effortlessly visualize the dispersion and skewness of data using the box and whiskers plot.
Table of Contents
import seaborn as sns
data = sns.load_dataset('titanic')
data = data.dropna()

from matplotlib.pyplot import boxplot
import matplotlib.pyplot as plt

boxplot(data['age'], labels = ['age'])
plt.title("Titanic passenger's age - bars and whiskers")
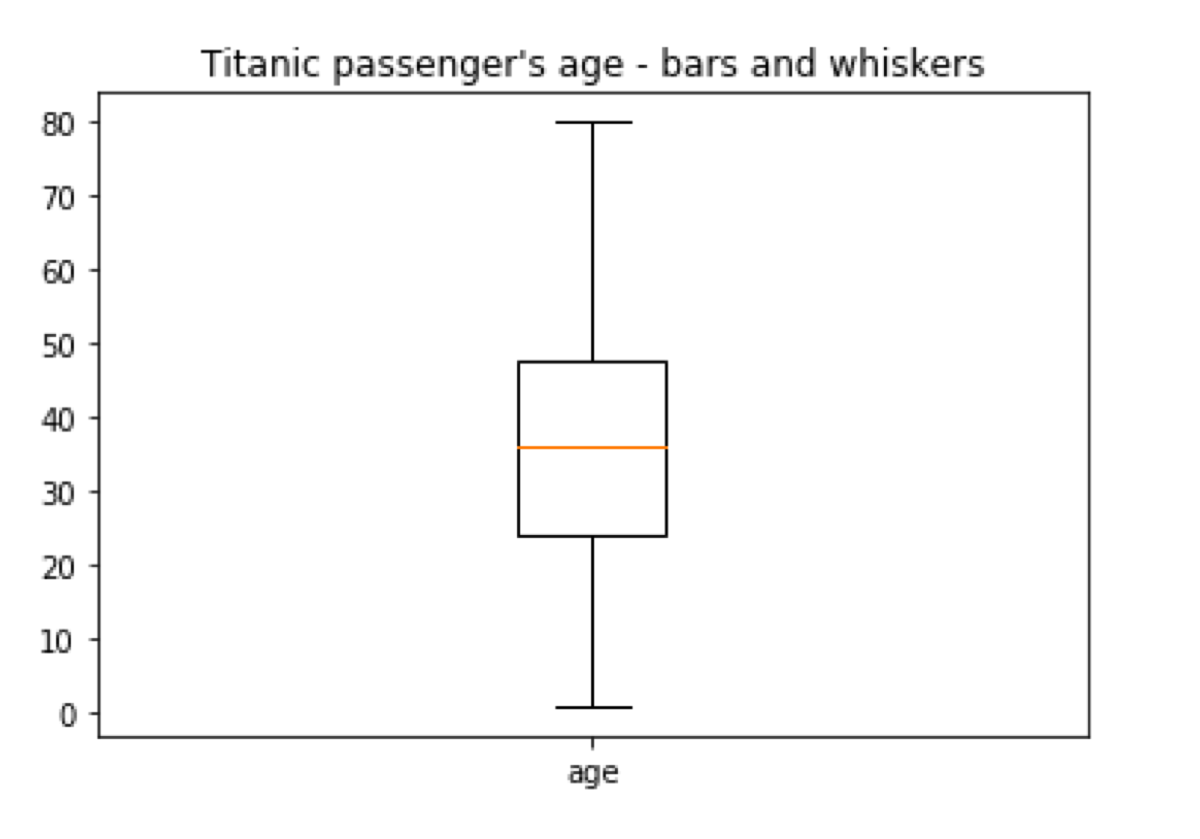
The plot consists of 3 elements:
-
The line inside the rectangle indicates the median of data.
-
The rectangle shows the interquartile range (IQR). Its lower edge is placed at the 25% percentile (1st quartile). The upper edge is at the 75% percentile (3rd quartile).
-
The T-shaped lines are the whiskers. Normally the range of the whiskers shows values which are between the 1st quartile (Q1) and a number (Q1 — IQR1.5). The upper whisker ends at the value = Q3 + IQR1.5.
In case of this plot, the whiskers end at the minimal and the maximal values.
Outliers
If we limit the whiskers range to 1*IQR we will see another part of the plot. The circles indicate outliers.
from matplotlib.pyplot import boxplot
import matplotlib.pyplot as plt

boxplot(data['age'], whis = 1, labels = ['age'])
plt.title("Titanic passenger's age - bars and whiskers")

We can also limit the whiskers to given percentiles. The plot will display value lower than the n-th percentile and larger than k-th percentile as outliers.
from matplotlib.pyplot import boxplot
import matplotlib.pyplot as plt

boxplot(data['age'], whis = [5, 95], labels = ['age'])
plt.title("Titanic passenger's age - bars and whiskers")
