To make time series data more smooth in Pandas, we can use the exponentially weighted window functions and calculate the exponentially weighted average.
First, I am going to load a dataset which contains Bitcoin prices recorded every minute.
data = pd.read_csv('../input/bitstampUSD_1-min_data_2012-01-01_to_2019-03-13.csv')
data['date'] = pd.to_datetime(data['Timestamp'], unit="s")

input_data = data[["date", "Close"]]

subset = input_data[input_data["date"] >= "2019-01-01"]
subset.set_index('date', inplace=True)
I want to plot their daily weighted average, so I must compress 3600 values into one using this function:
subset['Close'].ewm(span = 3600).mean()
We see that by default the adjusted version of the weighted average function is used, so the first element of the time series is not 0.
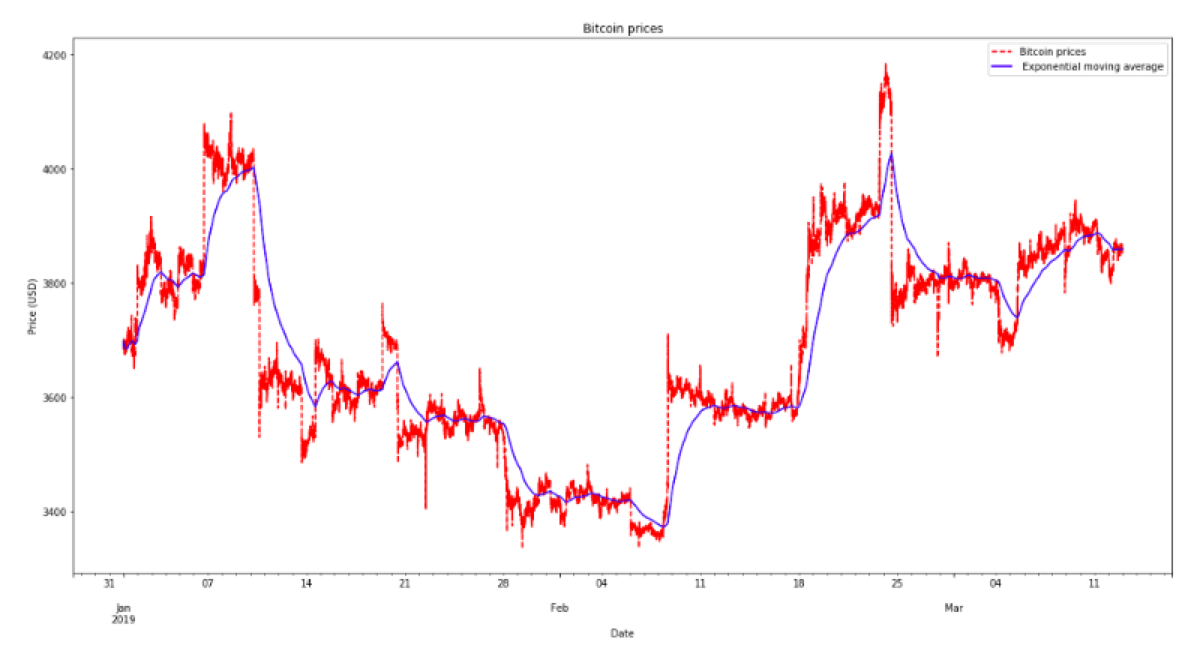
Finally, I can plot the original data and both the smoothed time series:
subset['Close'].plot(style = 'r--', label = 'Bitcoin prices')
subset['Close'].ewm(span = 3600).mean().plot(style = 'b', label = ' Exponential moving average')

plt.legend()
plt.title("Bitcoin prices")
plt.xlabel('Date')
plt.ylabel('Price (USD)')