
Imagine that you have a data frame of tweets and you want to create a word cloud. You can do it using the wordcloud library. In this example the data variable is a Pandas dataframe which has a columns Tweet.
from wordcloud import WordCloud, STOPWORDS
import matplotlib.pyplot as plt
text = data.Tweet.values
wordcloud = WordCloud(
    width = 3000,
    height = 2000,
    background_color = 'black',
    stopwords = STOPWORDS).generate(str(text))
fig = plt.figure(
    figsize = (40, 30),
    facecolor = 'k',
    edgecolor = 'k')
plt.imshow(wordcloud, interpolation = 'bilinear')
plt.axis('off')
plt.tight_layout(pad=0)
plt.show()
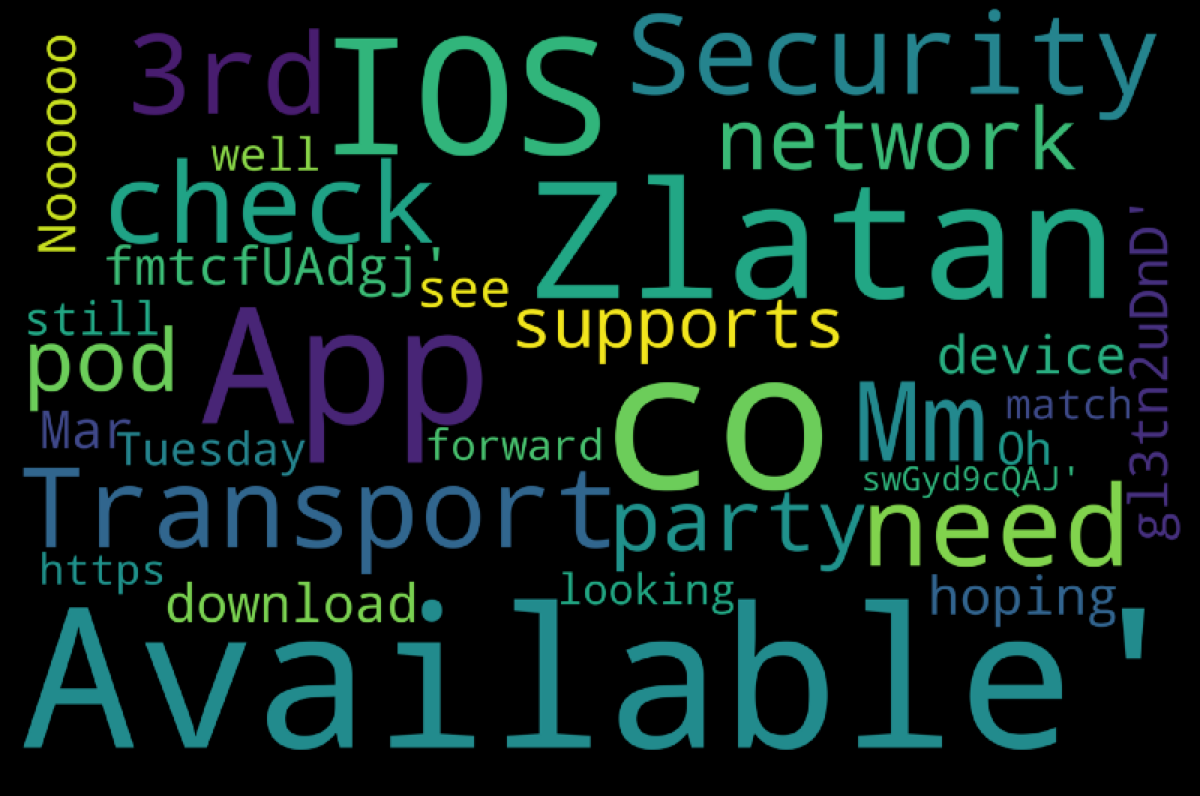
In real life, you should do some preprocessing and remove words which should not appear in the output plot. In case of tweets, you may need to remove not only the stopwords but also URLs and nicknames.