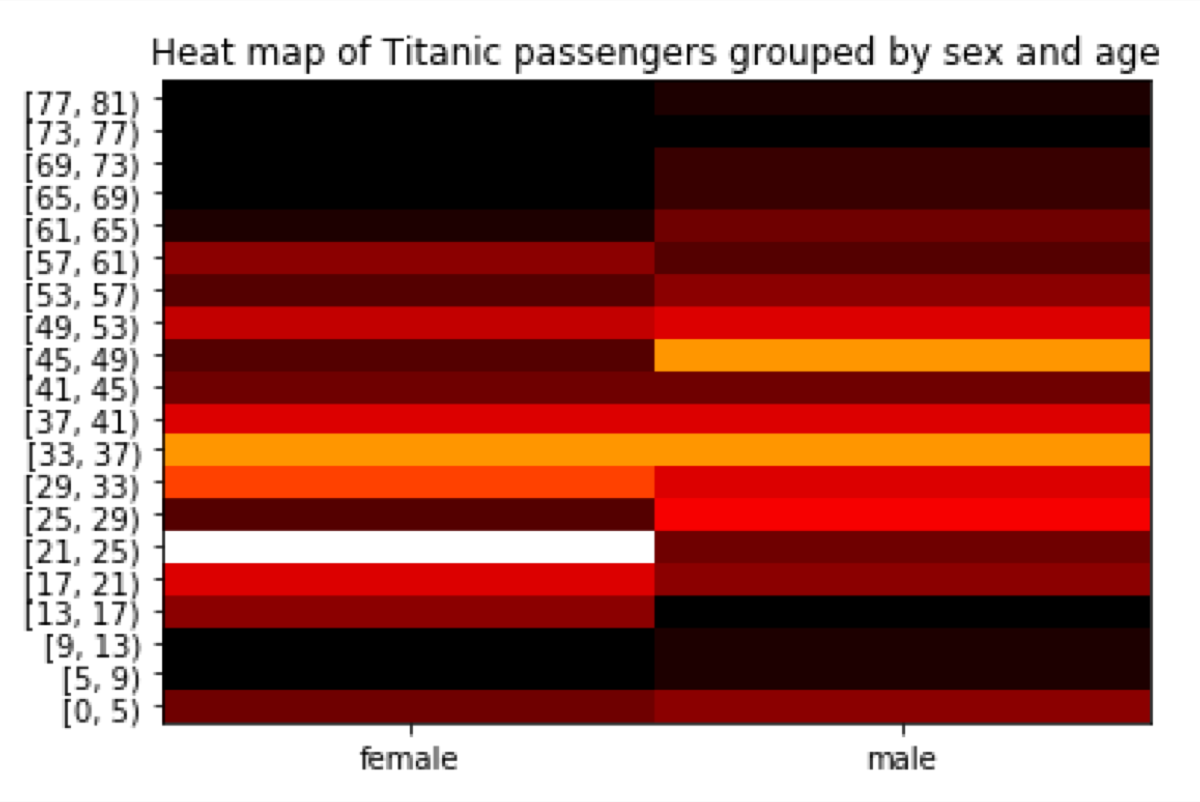
Let’s load the Titanic dataset. We will create a heat map of the number of people grouped by age group and gender. I drop the empty values because dealing with missing values is not a part of this tutorial.
import seaborn as sns
import numpy as np
import pandas as pd
import matplotlib as mp
import matplotlib.pyplot as plt
import math

titanic = sns.load_dataset('titanic')
titanic = titanic.copy()
titanic = titanic.dropna()
titanic

I want to group people in 20 age groups. I need to calculate the interval between ages and generate the bins. Note that we generate right-open intervals.
number_of_bins = 20
min_age = titanic['age'].min()
max_age = titanic['age'].max()
interval = (max_age - min_age) / number_of_bins
bins =  np.arange(min_age, max_age, interval)
Now, we assign people to the correct age group and group all passengers by the sex and age_bins columns.
age_bins = np.digitize(titanic['age'], bins)
titanic['age_bins'] = age_bins
headcount = titanic \
  .groupby(['sex', 'age_bins']) \
  .count() \
  .rename(columns = {'survived': 'number_of_people'}) \
  .filter(['sex', 'age_bins', 'number_of_people']) \
  .reset_index()
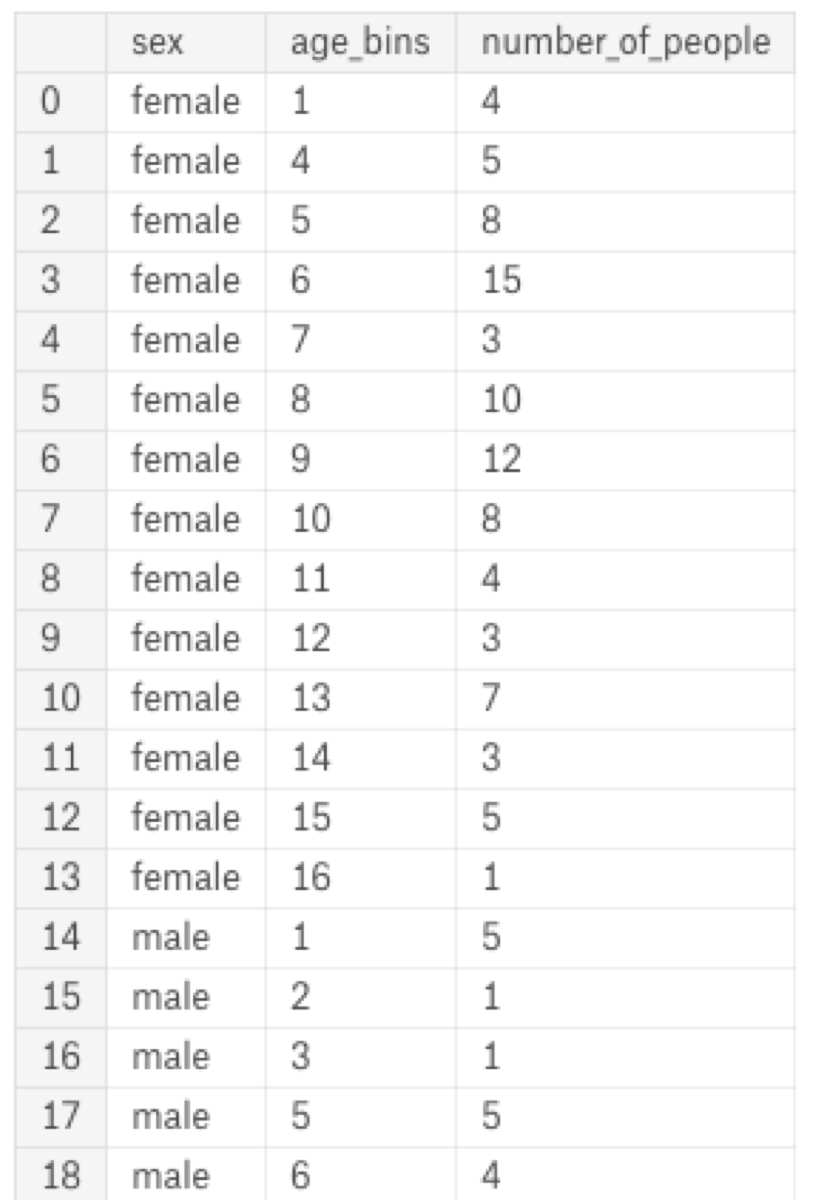
We have a data frame which looks like this:

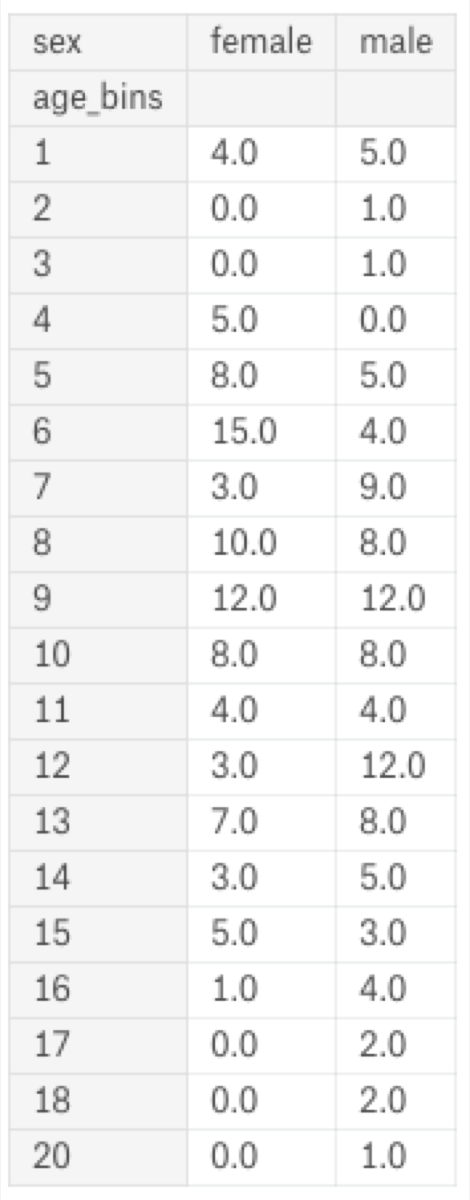
I want the use age_bins as the data frame index and convert the sex column into two columns: “female” and “male” which contain the number of people in the corresponding group. To do it, I must use the pivot function:
heatmapvalues = headcount.pivot(index = 'age_bins', columns = 'sex').fillna(0)
heatmapvalues = heatmapvalues['number_of_people'].copy()
heatmapvalues

Have you noticed that there is no value for index 19? ;) I will add it manually to the data frame.
line = pd.DataFrame({"female": 0, "male": 0}, index = [19])
heatmapvalues = heatmapvalues.append(line, ignore_index = False)
heatmapvalues = heatmapvalues.sort_index().reset_index(drop = True)
Now, I can generate the first version of the heat map. The first parameter of both yticks and xticks sets the position of labels.
color_map = mp.cm.get_cmap('gist_heat')
plt.pcolor(heatmapvalues, cmap = color_map)
plt.yticks(
  np.arange(0.5, len(heatmapvalues.index), 1),
  heatmapvalues.index
)
plt.xticks(
  np.arange(0.5, len(heatmapvalues.columns), 1),
  heatmapvalues.columns
)
plt.show()

Unfortunately, there is an index used as the y-axis values instead of the age intervals. We need to fix that. We will also add the title.
It makes no sense that one of the bins start at age 12.782. It would be more readable for humans if such age bin started at 13. So I round all the bins up. Note that it will “break” the first bean. We need to reset its value back to 0.
closed_interval = np.vectorize(lambda x: math.ceil(x))(bins)
closed_interval[0] = 0
Now, we can generate the values of the end of the intervals. Intervals are right-open, so the max age cannot be used as the end of the last interval. I added 1 to the max age because of that.
open_interval = np.append(closed_interval, [max_age + 1])[1:]
I want to use both arrays as the labels of the y-axis. So I need to zip them and format the values to get a string which follows the rules of “interval notation.”
intervals = np.stack((closed_interval, open_interval), axis = 1)
interval_desciptions = list(map(lambda x: "[{}, {})".format(int(x[0]), int(x[1])), intervals))
As the last step, I am going to use the interval descriptions as the y-axis and set the heat map title:
color_map = mp.cm.get_cmap('gist_heat')
plt.pcolor(heatmapvalues, cmap = color_map)
plt.title("Heat map of Titanic passengers grouped by sex and age")
plt.yticks(
    np.arange(0.5, len(interval_desciptions), 1),
    interval_desciptions
)
plt.xticks(
    np.arange(0.5, len(heatmapvalues.columns), 1),
    heatmapvalues.columns
)
plt.show()


