In this article, I am going to show you how to plot the decision trees generated by XGBoost models. First, we have to install graphviz (both python library and executable files)
!pip install graphviz
!apt-get install graphviz
When the graphviz library is installed, we can train an XGBoost model (in this example, I am going to train it using the Titanic dataset).
from xgboost import XGBClassifier
from xgboost import plot_tree
#(...) other imports

#(...) loading the dataset and data preprocessing

model = XGBClassifier()
model.fit(X_train, y_train, verbose=True, eval_set=[(X_test, y_test)])
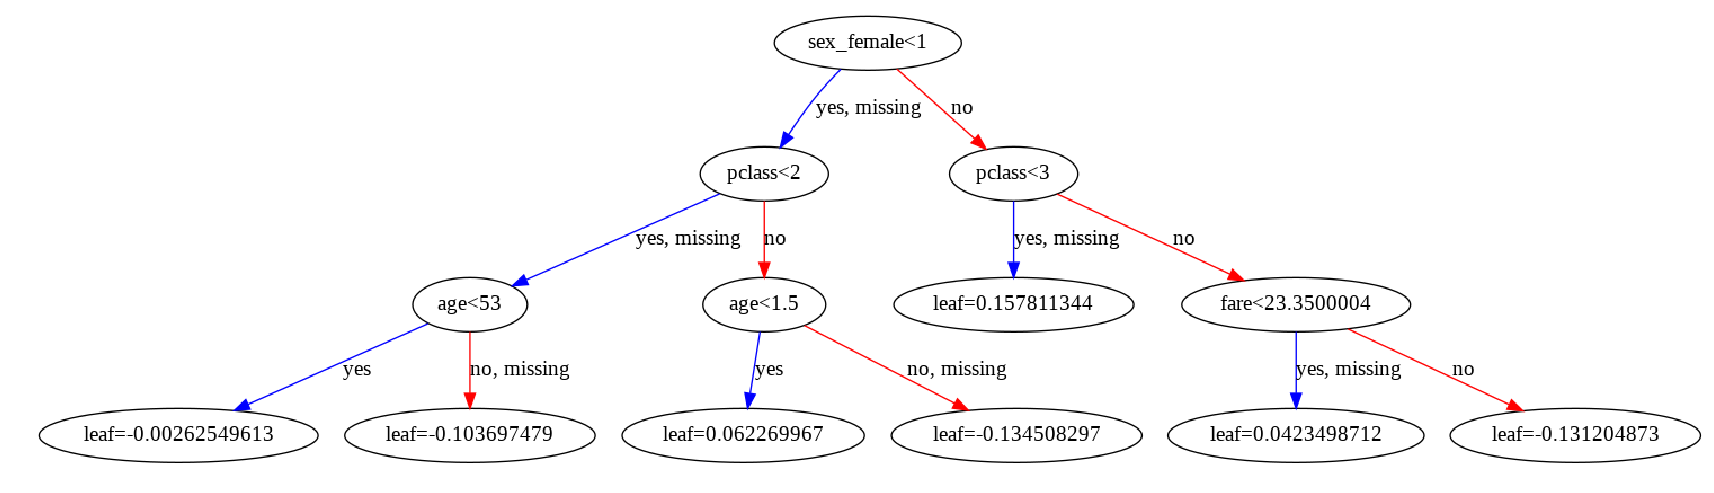
To display the trees, we have to use the plot_tree function provided by XGBoost.
It is important to change the size of the plot because the default one is not readable. The num_trees indicates the tree that should be drawn not the number of trees, so when I set the value to two, I get the second tree generated by XGBoost.
plot_tree(model, num_trees=1)
fig = plt.gcf()
fig.set_size_inches(30, 15)