
In this article, I am going to show how to prepare a Pandas data frame to use it as an input for a recurrent neural network (for example, LSTM).
Table of Contents
As an example, I am going to use a data set of Bitcoin prices. My goal is to train a neural network to use data from the current day + the past 29 days (so 30 days in total) to predict the BTC price during the next seven days.
In my input data frame, I have average daily prices indexed by date.
btc_prices.head()

#date
#2011-12-31    4.471603
#2012-01-01    4.806667
#2012-01-02    5.000000
#2012-01-03    5.252500
#2012-01-04    5.208159
Now, I am going to define a function which takes as arguments the data frame to be split, the number of days to be used as independent features (input), and the number of days which are the dependent features (target).
Prepare historical and future data
def build_training_data(dataset, history_size = 30, target_size = 7):
    start_index = history_size
    end_index = len(dataset) - target_size

    data = []
    labels = []

    for i in range(start_index, end_index):
        indices = range(i - history_size, i, 1)
        data.append(dataset[indices])
        labels.append(dataset[i:i + target_size])

    data = np.array(data)
    labels = np.array(labels)
    return data, labels

dataset = btc_prices.values
data, labels = build_training_data(dataset)
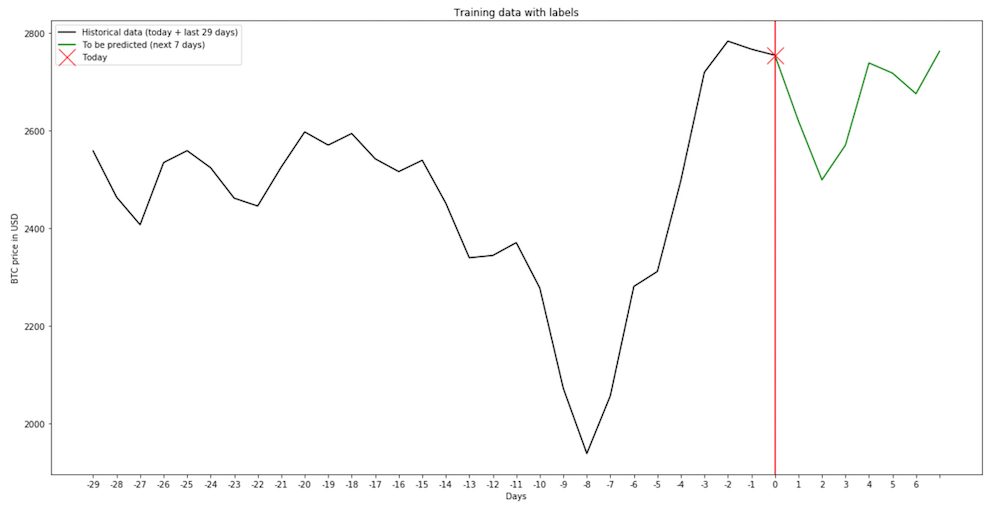
To show that the function works correctly, I pick a day (in this case, the 2000th day in the data frame) and plot both the data for that date and the labels.
plt.rcParams["figure.figsize"] = (20,10)

day = 2000
plt.plot(range(0, 30), data[day], 'k-', label = 'Historical data (today + last 29 days)')
plt.plot(range(29, 37), np.concatenate([data[day][29:], labels[day]]), 'g-', label = 'To be predicted (next 7 days)')
plt.axvline(x=29, c = 'r')
plt.plot(29, data[day][29], 'rx', markersize = 20, label = "Today")
plt.xticks(range(0, 37), range(-29, 7))
plt.title('Training data with labels')
plt.xlabel('Days')
plt.ylabel('BTC price in USD')
plt.legend()
plt.show()
The part that is not shown here
Remember to split the data into training, validation, and test data frame. Additionally, we must normalize all data (using the mean and standard deviation of the training set).
Preparing LSTM input
Before I can use it as the input for LSTM, I have to reshape the values. I have values of a single feature for 30 days, so the correct shape of the input data frame is (-1, 30, 1).
The label data frame contains seven values of a single feature, so its shape is (-1, 7, 1).
x_train = x_train.reshape((-1, 30, 1))
y_train = y_train.reshape((-1, 7))

x_validation = x_validation.reshape((-1, 30, 1))
y_validation = y_validation.reshape((-1, 7))

x_test = x_test.reshape((-1, 30, 1))
y_test = y_test.reshape((-1, 7))
Neural network
To configure the neural network correctly, we have to set (30, 1) as the shape of the input layer and use seven neurons in the output layer.
tf.keras.models.Sequential([
    tf.keras.layers.LSTM(24, input_shape=(30, 1), return_sequences = True),
    # put the rest of the layers here
    tf.keras.layers.Dense(7, activation='linear')
])