I started the “What’s cooking?” Kaggle challenge and wanted to do some data analysis. The given data set consists of three columns. Unfortunately, the last one is a list of ingredients.
Table of Contents

I wanted to calculate how often an ingredient is used in every cuisine and how many cuisines use the ingredient. I had to split the list in the last column and use its values as rows. Additionally, I had to add the correct cuisine to every row.
Let’s look at an example. If my dataset looks like this:
cuisine_1,id_1,[ingredient_1, ingredient_2, ingredient_3]
cuisine_2,id_2,[ingredient_4, ingredient_5]
Note that my third column is a list of strings! If you have a column with a string that contains multiple values separated by a comma, you have to split those strings into lists of strings first!
I want that output:
cuisine_1,id_1,ingredient_1
cuisine_1,id_1,ingredient_2
cuisine_1,id_1,ingredient_3
cuisine_2,id_2,ingredient_4
cuisine_2,id_2,ingredient_5
In this article, I am going to show you how to do it in two ways. First, I will use the for loops. Later, I will use only built-in Pandas functions.
The for loop way
My first idea was to iterate over the rows and put them into the structure I want. I wrote some code that was doing the job and worked correctly but did not look like Pandas code. Look at this, I dissected the data frame and rebuilt it:
ingredients = []
cuisines = []
ids = []
for _, row in data.iterrows():
    cuisine = row.cuisine
    identifier = row.id
    for ingredient in row.ingredients:
        cuisines.append(cuisine)
        ingredients.append(ingredient)
        ids.append(identifier)
ingredient_to_cuisine = pd.DataFrame({
    "id": ids,
    "ingredient": ingredients,
    "cuisine": cuisines
})
There must be a better way to do it.
The better way
Let’s do it step by step. Before each step, I will explain what function I am going to use and why. If you are interested in the full code with no explanation, scroll to the last code snippet.
Firstly, we have to split the ingredients column (which contains a list of values) into new columns. It is easy to do, and the output preserves the index. The index is important. We are going to need it.
data.ingredients.apply(pd.Series)

Now we can merge the new columns with the rest of the data set. There is a lot of empty values, but that is fine. We will get rid of them later:
data.ingredients.apply(pd.Series) \
    .merge(data, left_index = True, right_index = True)

First of all, I don’t need the old ingredients column anymore. So, let’s drop it:
data.ingredients.apply(pd.Series) \
    .merge(data, right_index = True, left_index = True) \
    .drop(["ingredients"], axis = 1)

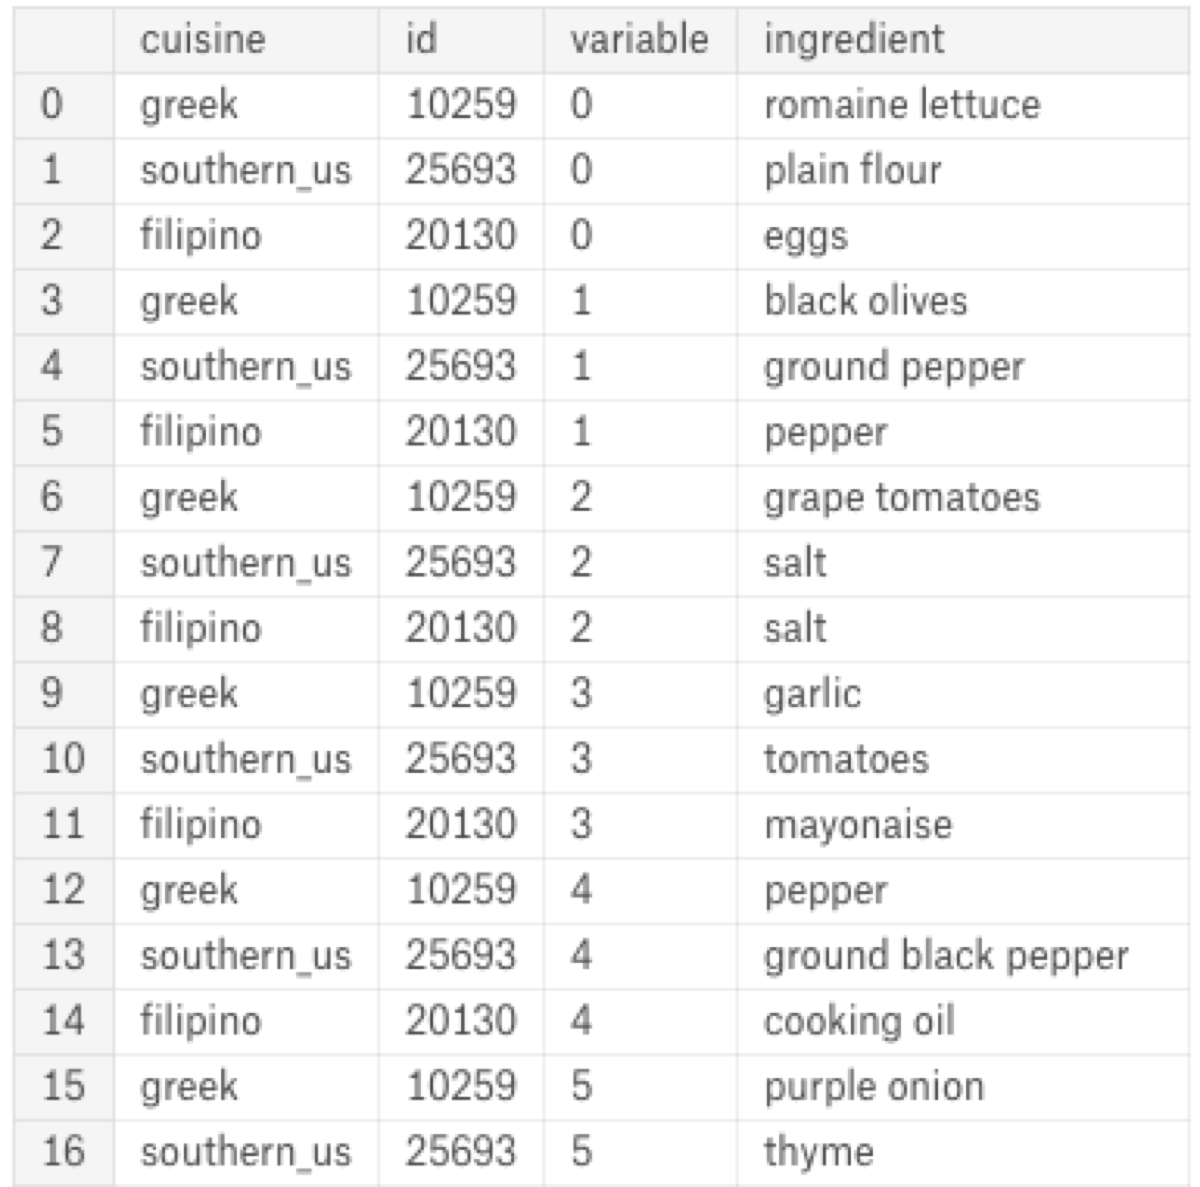
Now we can transform the numeric columns into separate rows using the melt function. Note that, I use the cuisine and the id as the identifier variables:
data.ingredients.apply(pd.Series) \
    .merge(data, right_index = True, left_index = True) \
    .drop(["ingredients"], axis = 1) \
    .melt(id_vars = ['cuisine', 'id'], value_name = "ingredient")

It looks like the variable column contains the ids of the numeric columns. It is useless therefore we can remove that too:
data.ingredients.apply(pd.Series) \
    .merge(data, right_index = True, left_index = True) \
    .drop(["ingredients"], axis = 1) \
    .melt(id_vars = ['cuisine', 'id'], value_name = "ingredient") \
    .drop("variable", axis = 1)

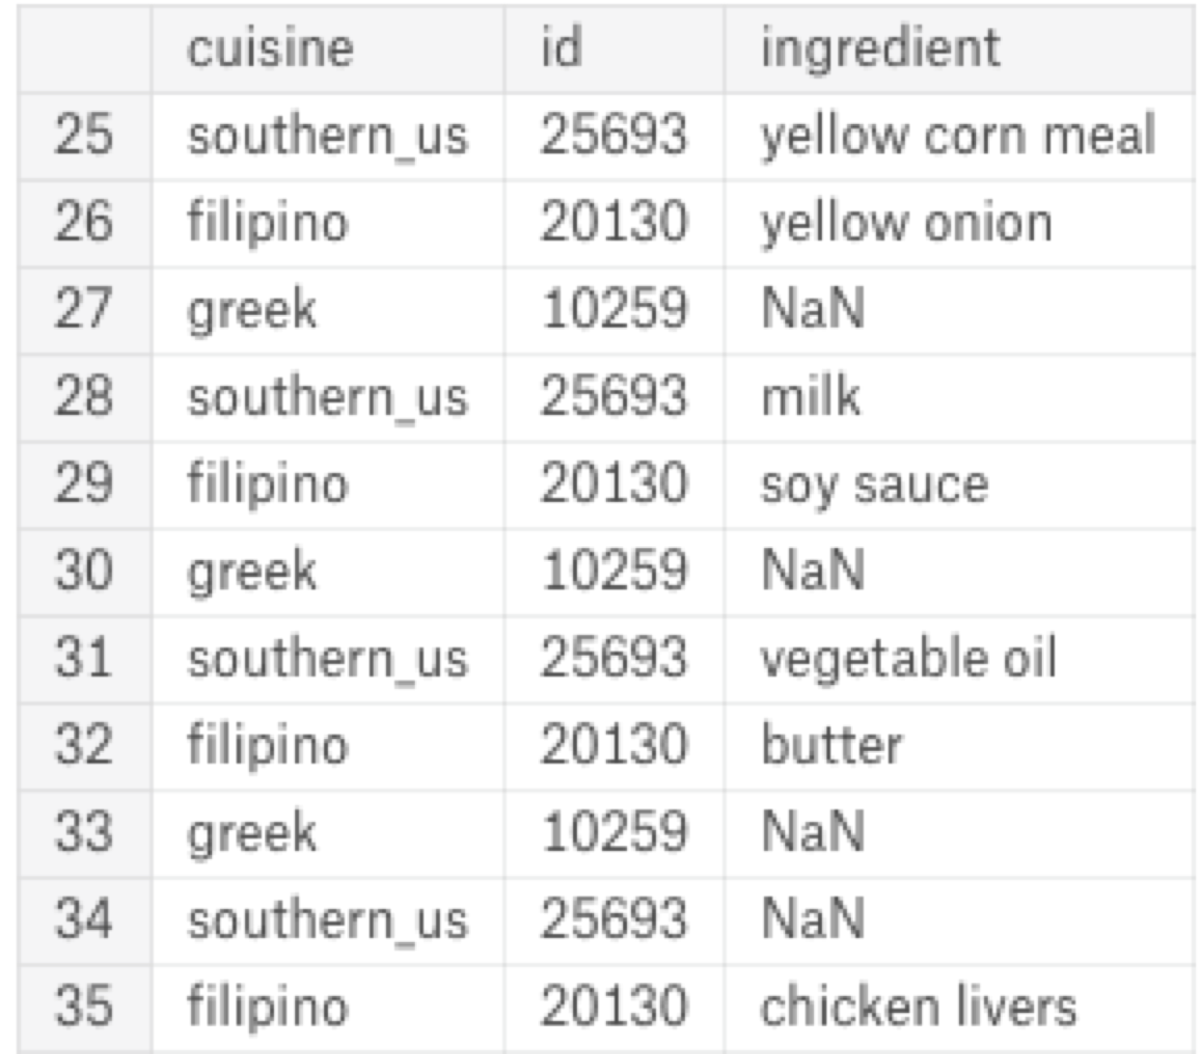
Now, it is time to remove the empty values:
data.ingredients.apply(pd.Series) \
    .merge(data, right_index = True, left_index = True) \
    .drop(["ingredients"], axis = 1) \
    .melt(id_vars = ['cuisine', 'id'], value_name = "ingredient") \
    .drop("variable", axis = 1) \
    .dropna()

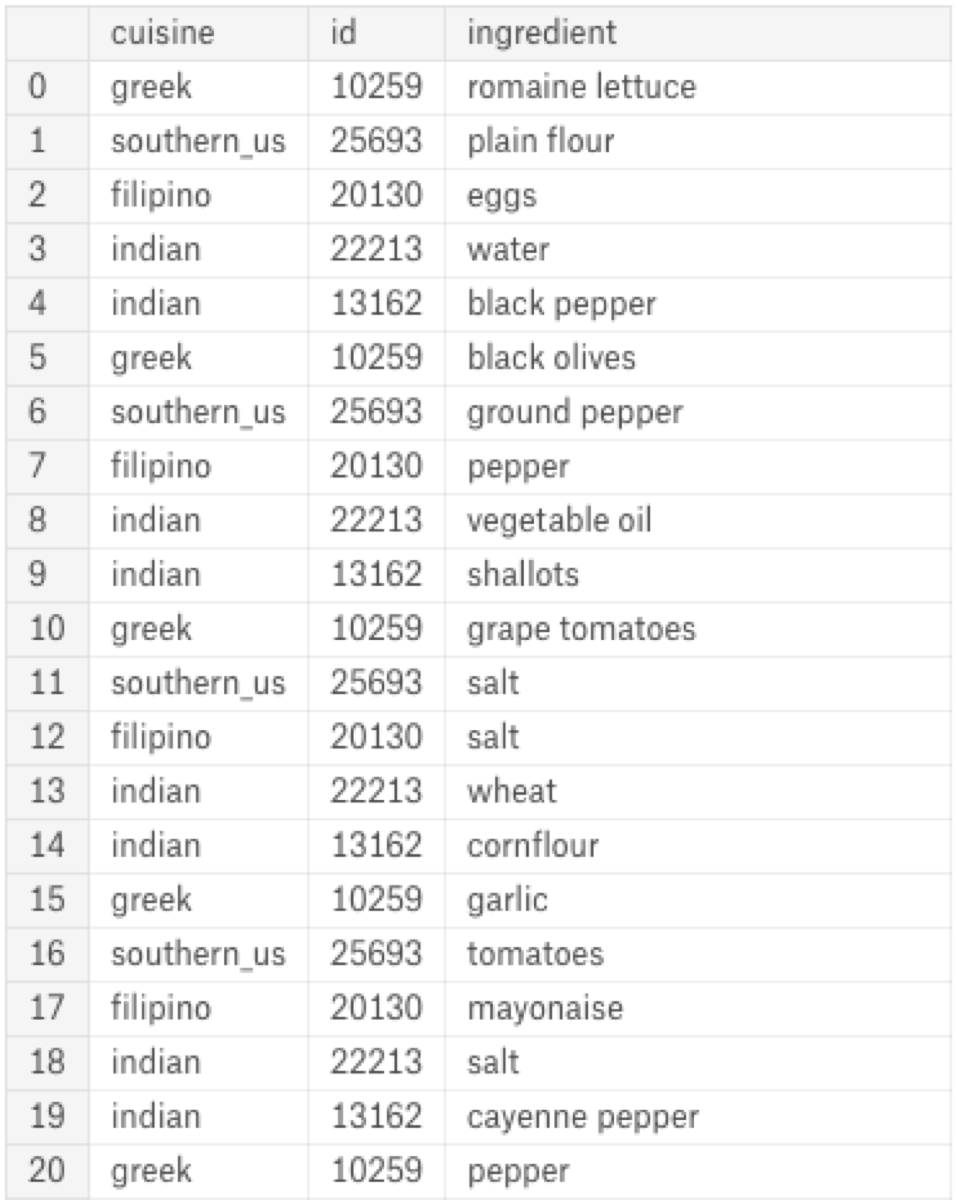
Done! Now we have a data set that has the ingredients in separate rows.

