
You can draw an interactive plot in Jupyter Notebook (with matplotlib) if you run this code before drawing the plot:
%matplotlib notebook
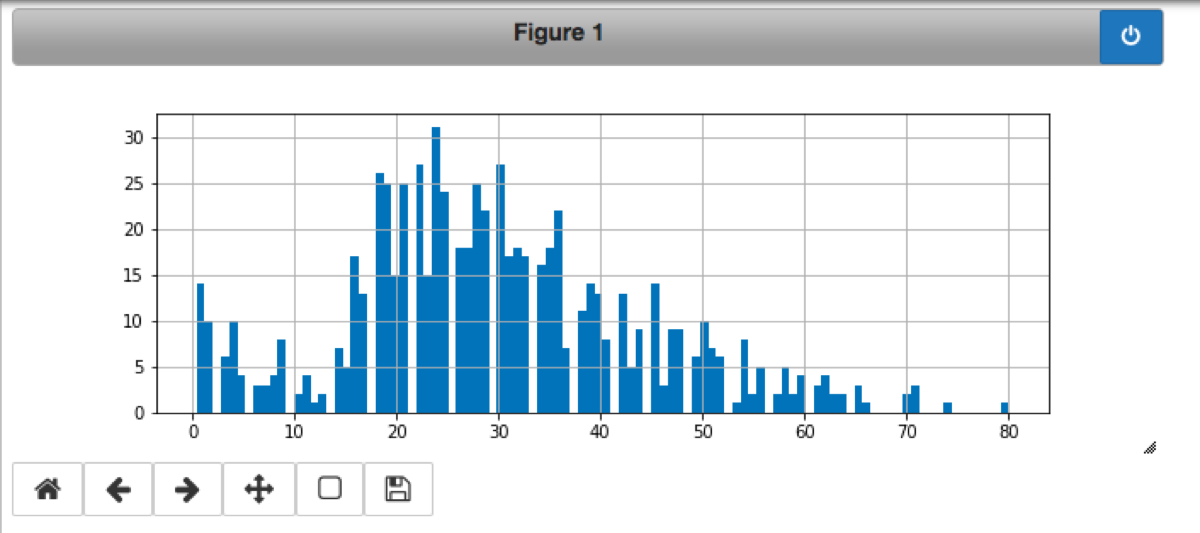
The interactive plot looks like this and supports zooming:
Note that you must run this line before every interactive plot you want to create. Also, the plot remains interactive until you call “%matplotlib notebook” again, change the mode to inline (“%matplotlib inline”) or quit the interactive mode by clicking the button in the top right corner of the plot.
If you draw a second plot while one of you plots is interactive the command will add another dataset to the existing plot instead of creating a new one:
