
Probability plot is a method of comparing probability distribution which can be easily interpreted by humans. It is not some weird number which is denoted by some Greek letter you can’t even pronounce correctly. Probability plot is just a picture.
Table of Contents
Probability plot with Scikit learn
Let’s plot the probability plot of the age variable from the Titanic dataset. I am going to check whether it fits to a normal distribution.
from scipy.stats import probplot
import seaborn as sea
import matplotlib.pyplot as plt
titanic = sea.load_dataset("titanic")
probplot(titanic.age, dist="norm", plot = plt)
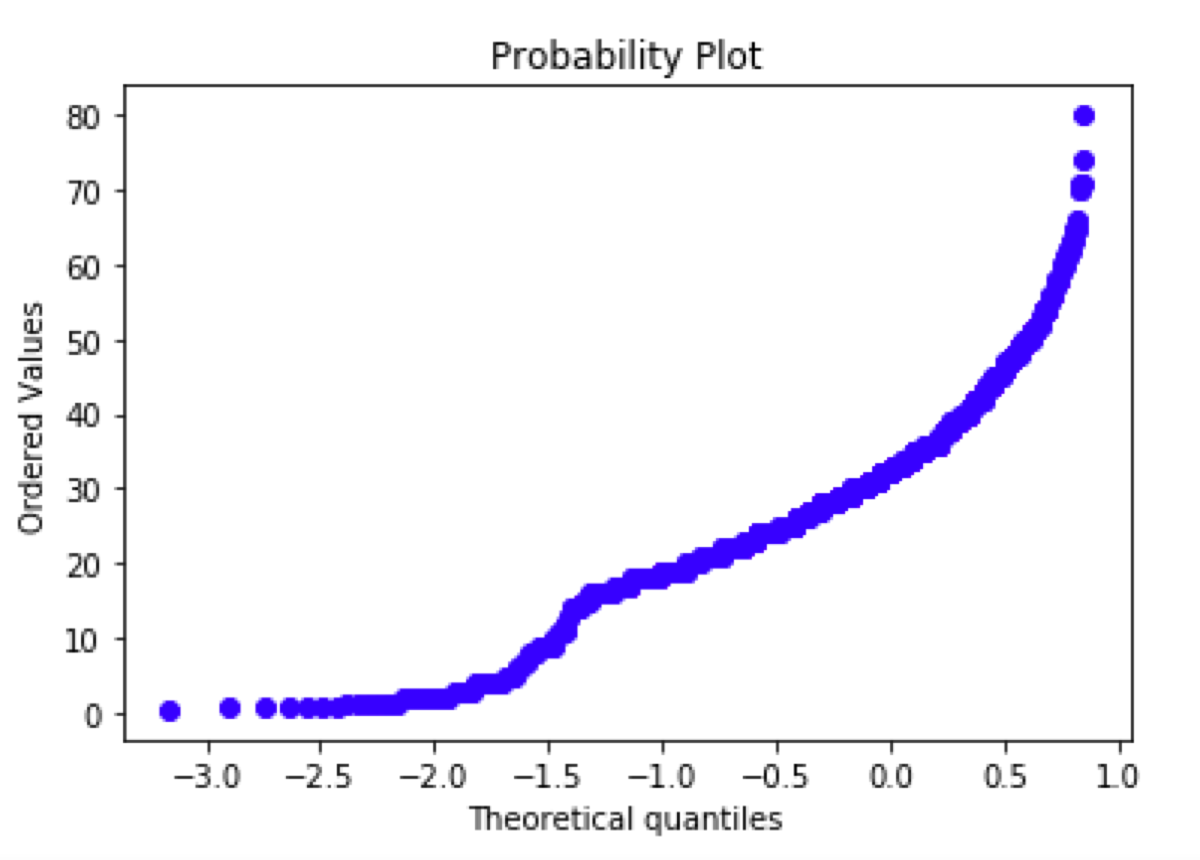
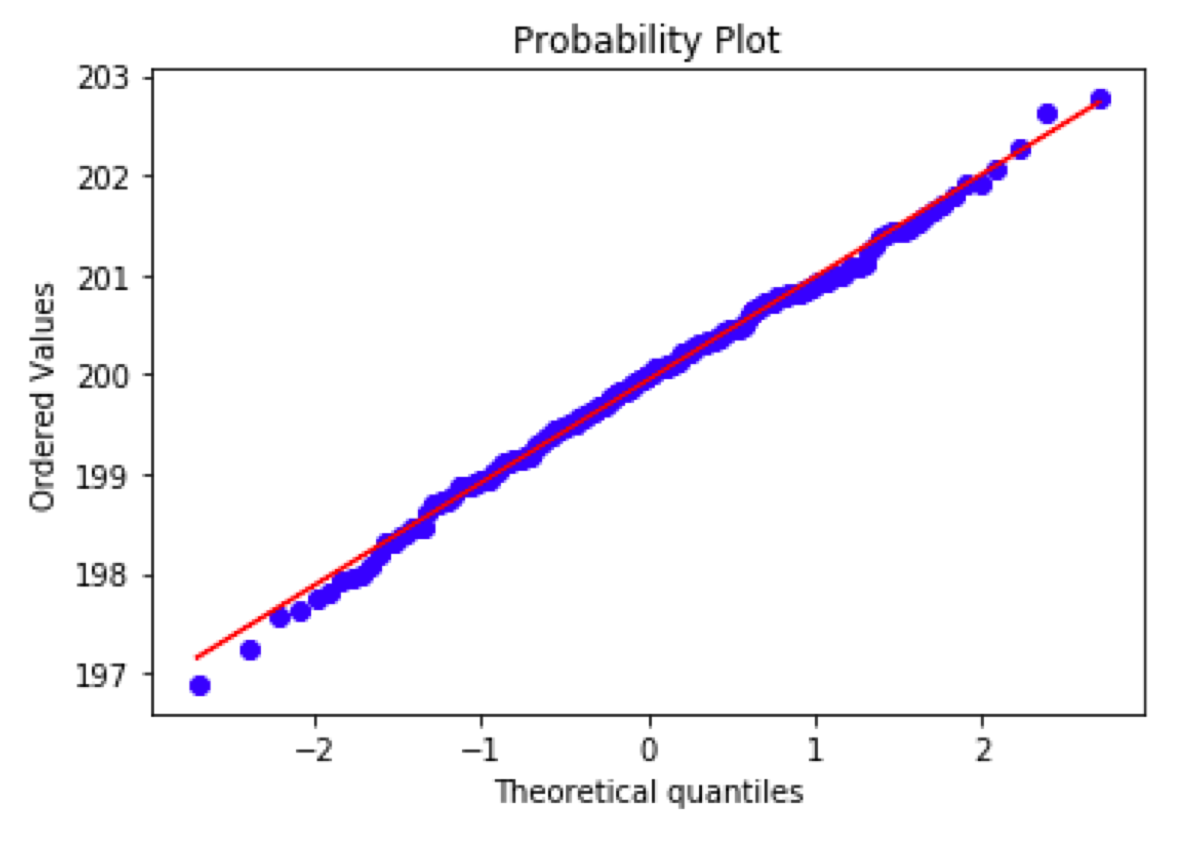
What do we know? The data is not normally distributed, that we know for sure. If it were the probability plot would look like this:
from scipy.stats import norm
example = norm.rvs(200, size = 200)
probplot(example, dist="norm", plot = plt)
What if we want to compare the data to a different kind of probability distribution? Just change the value of the “dist” parameter. The interpretation of the output stays the same.
Interpretation
If the distribution of given sample fits the given probability distribution, the plot displays a line that follows the line x = y (the second plot in this blog post).
What does the first plot mean? An arced line (or even S-shaped line) indicates that the given sample distribution is skewed or has a “heavy tail”. Is it true? Let’s look at the age variable histogram:
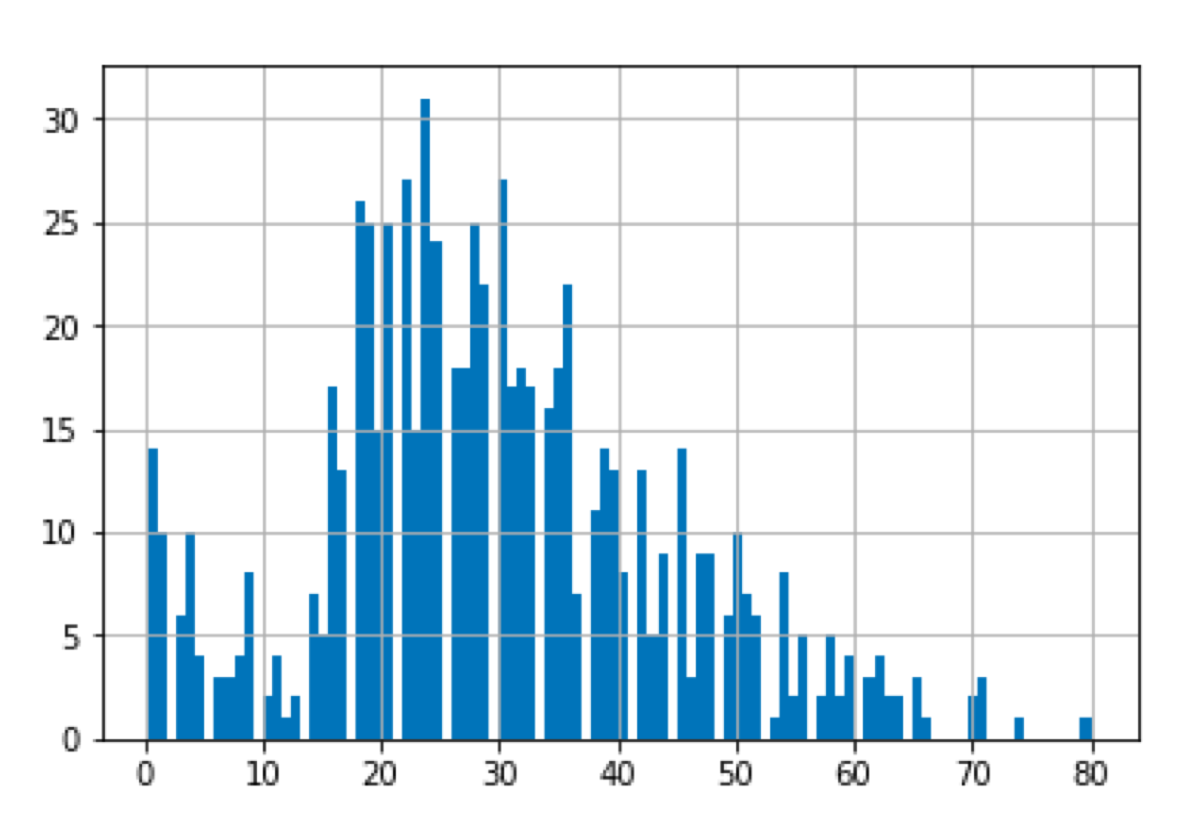
As expected the distribution is skewed.
Why the probability plot is useful? You can quickly draw the plot, look at it, and know whether the sample has the expected distribution. You don’t need a statistical test. You don’t need to think about the significance level. You don’t need to think about the null hypothesis and the alternative hypothesis. You don’t need to decide whether you want to use a Shapiro–Wilk test, Kolmogorov–Smirnov test or something else. You just make a plot and look at it ;)